
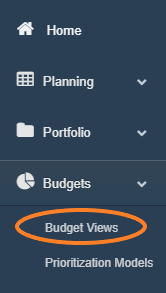
1. Access the Budget Views screen by selecting the 'Budget Views' option from the Budgets menu drop-down.
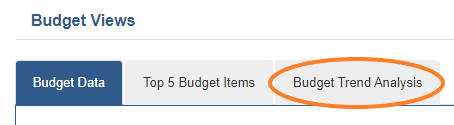
2. Select the 'Budget Trend Analysis' tab
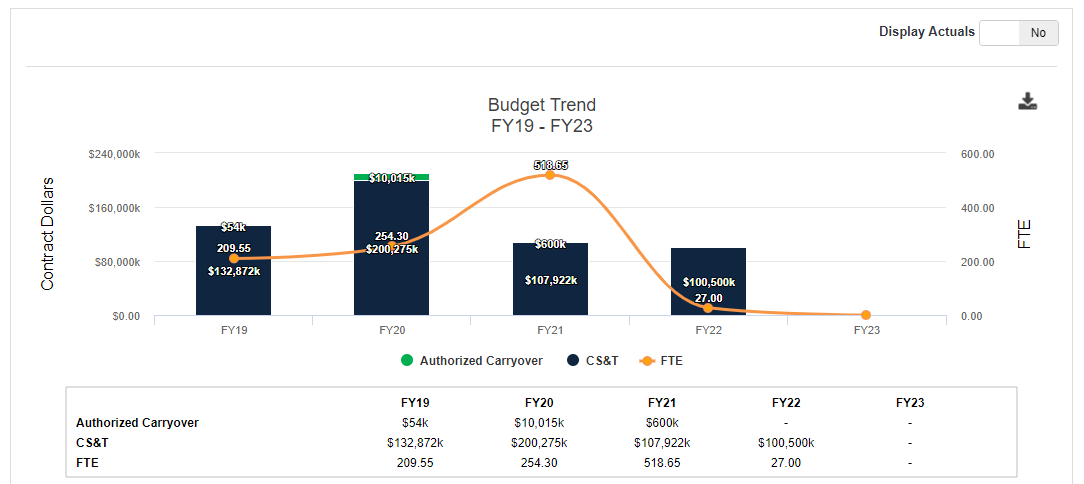
- The graph displays the Contract Dollars (bar chart) and FTE (line graph) across 5 FYs, with the selected FY as the middle value.
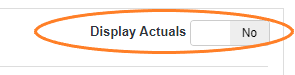
3. To display Actuals data on this graph, update the 'Display Actuals' toggle in the top right of the page from 'No' to 'Yes'.
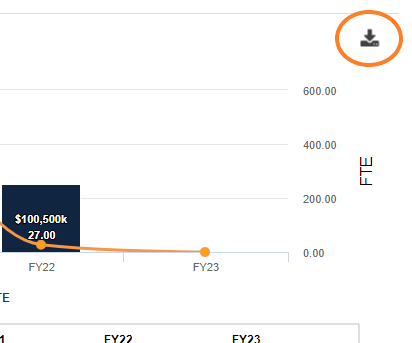
4. To download a copy of the graph, select the 'Download Image' icon in the top right of the graph.
Comments
0 comments
Please sign in to leave a comment.